 secondarymortgage.com
Yield Curves
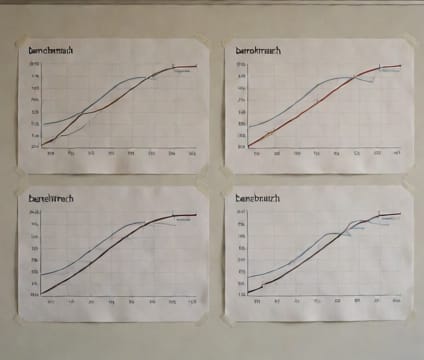
Agency MBS par yields broken down by coupon and maturity, sourced from industry price feeds to support comparative yield analysis.
Understanding how yield curves behave across coupons and maturities helps investors gauge relative value between different Agency issues. For example, a steeper curve between 3.0% and 4.0% coupons over 10-year maturities may signal expectation shifts in refinance activity or duration risk, even without directional rate calls. Traders often monitor coupon convexity mismatches to time entry or hedging, particularly near major Fed policy shifts or housing report releases.
When comparing curves across vintages, a key insight is how coupon sensitivity changes with interest rate regimes. In rising rate environments, lower-coupon securities typically widen in yield more sharply than higher-coupon issues due to greater prepayment uncertainty. This behavior reflects the interplay between interest rate risk and option-adjusted spread dynamics—crucial for portfolio matching and duration targeting.
Yield curve references also support risk allocation across tranches—especially in CMO structures where coupons dictate cash flow priority and timing. Analysts use curve shapes to estimate effective duration and option-adjusted spread for stress-testing portfolio resilience under various rate scenarios, even when actual prepayment behavior remains uncertain or unobserved in real time.