 census.com
Census Tracts
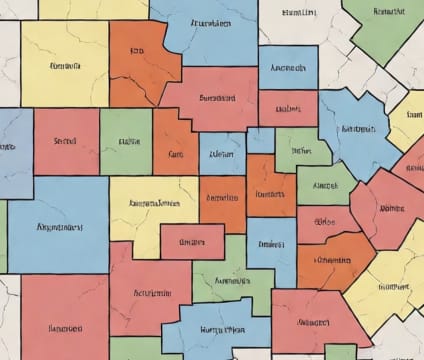
Census tracts provide detailed neighborhood-level data for precise demographic and socioeconomic analysis.
Census tracts are carefully designed to be relatively homogeneous units with respect to population characteristics, economic status, and living conditions, averaging about 4,000 inhabitants. They serve as the smallest geographic entity for which decennial and ACS data are published, enabling granular analysis of housing, income, race, and age patterns. This level of detail is essential when assessing neighborhood change, targeting service delivery, or evaluating the localized impact of policy initiatives.
When comparing adjacent areas, tracts allow researchers to discern micro-level disparities that may be masked in broader geographies. For instance, income inequality or health outcomes can differ significantly between neighboring tracts even within the same city. Analysts use tract-level data to map food deserts, plan public transit routes, or identify areas at risk of displacement due to gentrification.
The American Community Survey provides five-year estimates for most tracts, increasing reliability in sparsely populated or stable regions. Data are published as part of the Decennial Census and ACS programs, maintained by the U.S. Census Bureau. Users can link tract-level records to spatial boundaries using TIGER/Line shapefiles or geocoded data products, ensuring alignment with ground truth and municipal planning zones.