 census.com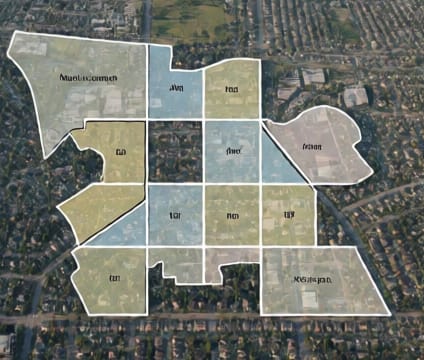
Census Tracts
Census tracts provide detailed neighborhood-level data for precise demographic and socioeconomic analysis.
Read more →Our Interactive Map Viewer puts official U.S. Census data at your fingertips, letting you overlay layers across geographies like census tracts, counties, core-based statistical areas, and school districts. Zoom, filter, and compare socioeconomic indicators with precision, then export clean vector and raster files for reports or publications—no watermarks, no delay. All visualizations derive directly from Census Bureau sources to ensure methodological consistency and transparency.
Census tracts provide detailed neighborhood-level data for precise demographic and socioeconomic analysis.
Read more →
Counties offer standardized administrative units for comparing population and economic data across states and regions.
Read more →
Core-Based Statistical Areas standardize urban region definitions for consistent analysis of metropolitan and micropolitan economies.
Read more →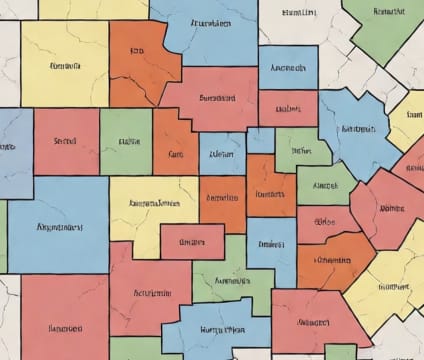
School district boundaries enable targeted demographic and educational outcome analysis aligned with operational school jurisdictions.
Read more →Questions or ideas about census.com? Send a note and we will get back to you.